It’s a truism that older people are more conservative than younger people. But this hasn’t always been the case, as the following table makes clear:
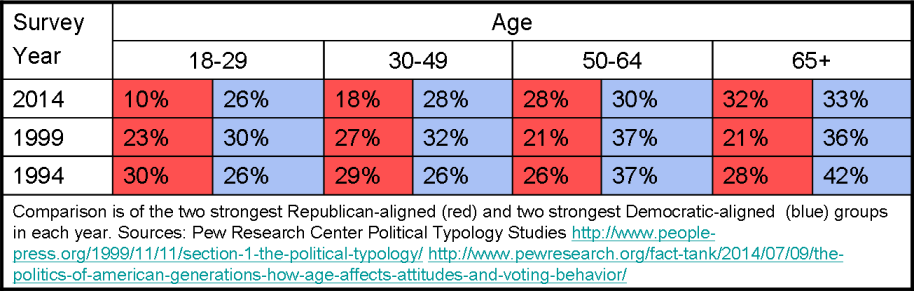
In 1994, young adults were more conservative and less liberal than old people. In 2014, it was just the opposite. What happened? Partly this pattern shift reflects a “cohort effect”: a lot of old people in 1994 were life-long New Deal Democrats, having come of age during the Great Depression, while many young people had come of age during the Reagan years.
If you want to figure out how age influences political attitudes, you have to control for the cohort effect and follow the same generation across their lifespan. Easier said than done. For one thing, you have to make sure you’re measuring the same thing year-to-year. Just asking people if they’re “liberal” or “conservative” isn’t going to work, because the meaning of those terms change over time. Ditto “Republican” versus “Democrat”: the parties keep changing.
We’re in luck though. Pew Research Center constructed a political typology that remained fairly consistent over the period of 1994- 2014, especially for groups most likely to vote Republican or Democrat: Social Conservatives and Business Conservatives/Enterprisers (Republican-aligned) and Solid Liberals and the “Faith and Family” Left (Democratic-aligned). For the sake of not torturing the English language, I will call these groups “Republicans” and “Democrats”.
Since the 1994 age-groups would be in the next older age category in 2014, it became simple to track changes in their political attitudes from 1994 to 2014. Yes, this is all very approximate - but it’s something. Check it out (Republican = red; Democrat = blue):
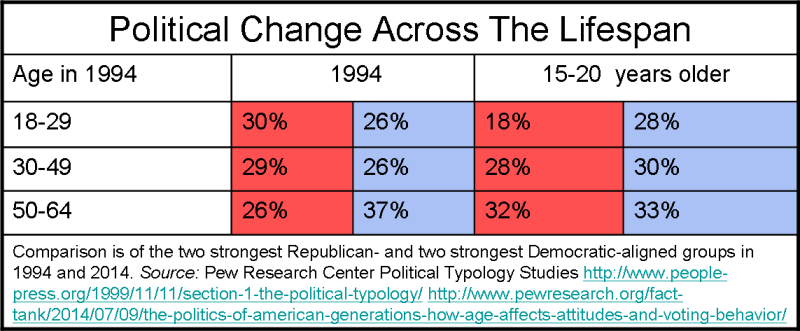
Basically, young adults in 1994 had become much less conservative by 2014, the middle age group more liberal, and the oldest group more conservative and less liberal. By 2014, the youngest group in 1994 was much less likely to be either Republican or Democrat (46%) compared to the oldest group (65%). This lack of strong party affiliation is also apparent in the 2014 18-29 year old cohort: just 36% were Republican or Democrat (see top table). It remains to be seen if these younger age groups will become more strongly affiliated with the traditional political parties as they get older.
But age group trends don’t tell us how much individuals change their political opinions over time. Once again, Pew has addressed this issue: in a 2016 survey, a third of the Republican respondents reported they had considered themselves Democrats at an earlier point in their lives, while about a fifth of the Democrats said they previously considered themselves Republicans. What that tells me is that political attitudes are relatively amenable to influence and aren’t carved in the stone of early socialization or fixed moral foundations.
—
*Plus a little over a fifth of Republicans reported that a “major reason” why they identified as Republicans is because they had always been a Republican, compared to a third of Democrats reporting that a “major reason” why they identified as Democrats is because they had always been a Democrat.
—
Reference:
The politics of American generations: How age affects attitudes and voting behavior by Drew DeSilver/Pew Research Center Fact Tank - Our Lives in Numbers July 9, 2014