The first chart is based on annual surveys of violent crime victims, covering the period of 2008-2019 and collected by the Bureau of Justice Statistics (BJS). Unfortunately, the BJS did not provide separate data for Asian victims, who are included in the ‘Other’ category.

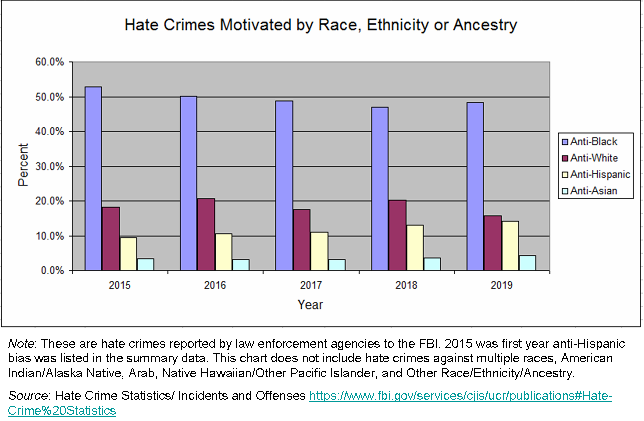
The next chart is hate crime data from thousands of law enforcement agencies, covering the period of 2015-2019 and compiled by the FBI:
The last chart summarizes 2015-2019 survey data on the rate of violent victimization by race or ethnicity. This time the BJS did provide specific information on the victimization of Asians.

I don’t see any strong trends in any of the above charts. Maybe 2020 or 2021 will tell a different story - but those numbers won’t be out for some time.
References:
Bureau of Justice Statistics, Violent Victimization by Race or Ethnicity, 2005-2019. Barbara A. Oudekerk, Ph.D., BJS Statistician. October 27, 2020; NCJ 255578 https://www.bjs.gov/index.cfm?ty=pbdetail&iid=7126
Bureau of Justice Statistics. Criminal Victimization, 2019. https://www.bjs.gov/index.cfm?ty=pbdetail&iid=7046
Bureau of Justice Statistics. Criminal Victimization, 2017 https://www.bjs.gov/index.cfm?ty=pbdetail&iid=6466
FBI Hate Crime Statistics/ Incidents and Offenses https://www.fbi.gov/services/cjis/ucr/publications#Hate-Crime%20Statistics