The FBI defines Metropolitan Statistical Areas (MSAs) as urbanized areas with a population of at least 50,000 inhabitants. MSAs include the principal city; the county in which the city is located; and adjacent counties determined to have a high degree of economic and social integration with the principal city and county as measured through commuting patterns. MSAs may cross state boundaries. The FBI refers to counties and smaller cities outside MSAs as Nonmetropolitan Areas.
The charts in this post are based on FBI tables, so the chart titles retain the FBI terminology. However, to keep things simple for post commentary, I’ll be using the following terms:
City: 50,000 inhabitants or more
Town: 10,000 – 49,999 inhabitants
Countryside: under 10,000 inhabitants
Ok, now for the charts, starting with violent crime rates:
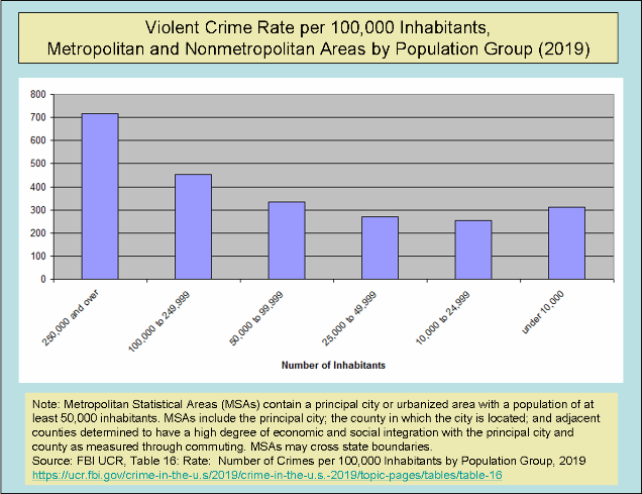
I see a clear pattern in the violent crime rates: smaller population = less crime , not counting the countryside. Now for property crime rates:

Same pattern as with violent crimes, including the uptick out in the countryside. What’s going on here?
Hell if I know. But my process for finding out would start with identifying factors associated with metro and nonmetro population size that are also associated with criminal behavior. Things like population density, unemployment rate, prevalence of divorced males, inequality, percent of population aged 15–29, density of drinking establishments, poverty, and residential stability, to name a few. I would also look at whether the risk and rewards of engaging in criminal behavior vary across city, town and countryside.
Perhaps the biggest risk is getting caught, as in arrested. And it just so happens the FBI has data for that, broken down by metro and nonmetro population groups, as follows:
No surprise here: the smaller the metro and nonmetro population group, the more likely offenses will be cleared by arrest, especially for property crimes, although once again the countryside doesn’t quite follow the pattern.
I’m thinking the areas with higher arrest rates have less crime in part because would-be offenders are more afraid of getting caught in those areas. Just a theory, but it would be in line with a large body of research on deterrence. To quote:
“Research shows clearly that the chance of being caught is a vastly more effective deterrent than even draconian punishment…. A criminal’s behavior is more likely to be influenced by seeing a police officer with handcuffs and a radio than by a new law increasing penalties.” - National Institute of Justice: Five Things about Deterrence; June 5, 2016
—
* The linear relationship between crime rate and metro population size breaks down at the extreme end of the continuum: the 50 largest cities in the US currently have lower crime rates than large cities with somewhat smaller populations. However, there are hundreds of Metropolitan Areas with at least 250,000 inhabitants in the US, so that population group taken as a whole still has the highest crime rates, compared to the other population groups.
References:
Chang, Yu S.; Kim, Hann E.; Jeon, Seongmin. 2019. "Do Larger Cities Experience Lower Crime Rates? A Scaling Analysis of 758 Cities in the U.S." Sustainability 11, no. 11: 3111. https://doi.org/10.3390/su11113111
FBI Uniform Crime Reports, Table 16: Rate: Number of Crimes per 100,000 Inhabitants by Population Group, 2019 https://ucr.fbi.gov/crime-in-the-u.s/2019/crime-in-the-u.s.-2019/topic-pages/tables/table-16
FBI Uniform Crime Reports, Table 25: Percent of Offenses Cleared by Arrest or Exceptional Means, by Population Group, 2018. https://ucr.fbi.gov/crime-in-the-u.s/2018/crime-in-the-u.s.-2018/topic-pages/tables/table-25
Liu, H. and X. Zhu (2017). "Joint Modeling of Multiple Crimes: A Bayesian Spatial Approach." ISPRS International Journal of Geo-Information 6(1): 16. https://doi.org/10.3390/ijgi6010016
National Institute of Justice: Five Things about Deterrence; June 5, 2016 https://nij.ojp.gov/topics/articles/five-things-about-deterrence