Recap:
The US federal deficit represents the amount of money the government borrows each year to cover the difference between what it spends and what it collects in taxes and other receipts. The federal government has so far spent $1.34 trillion more this fiscal year than it has collected (U.S. Treasury).
The national debt represents the total amount of outstanding borrowing accumulated over the nation’s history. As the federal government experiences reoccurring deficits, the national debt grows. Currently, the national debt is just about $37 trillion (U.S. Treasury). The national debt is expected to surpass the all-time record of 106% of Gross Domestic Product (GDP) by 2029. To put that in perspective, the average over the last 50 years was about 49% of GDP.
My goal throughout this series has been to cut $8.1 trillion (T) from the Federal Budget to stabilize the debt at 100% of GDP by 2035. So far I’ve saved $6.55T by choosing various budget and policy options. See Part II, Part III and Part V for details.
Not bad, but $6.55T is still $1.55T short of the goal. I guess it’s time for me to turn my attention to an obvious source of tax revenue: the rich! But I don’t want to soak the rich, tax-wise. After all, the rich invest a big chunk of their millions and billions in ways that boost innovation, entrepreneurship and economic growth - hit them too hard with higher taxes and the GDP will take a hit as well. So how much is enough, but not too much? Economists are not of one mind on that question and I certainly don’t know the answer.
I think a first step is to figure out how much the rich already pay in taxes, not just federal but the entire tax bill: federal. state, local and foreign taxes (e.g. capital gains on foreign investments). This is known as the “effective tax rate”: not the sticker price but what is actually paid. It turns out rich Americans already pay pretty high taxes:
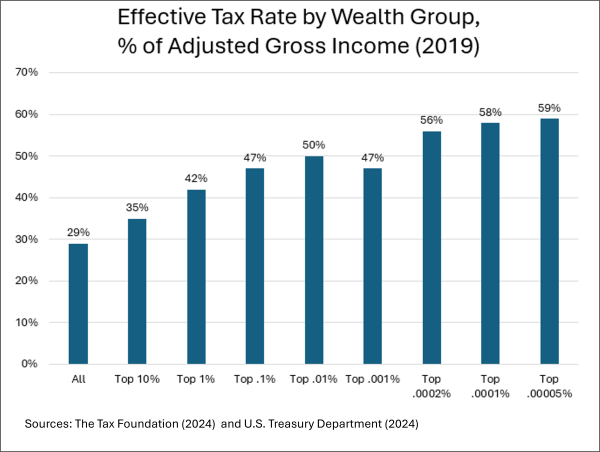
And here’s what’s left after paying those taxes:
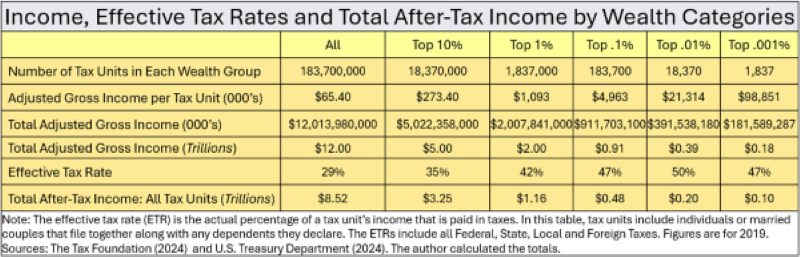
Note that the entire after-tax income of the top 1% isn’t enough to close the federal deficit gap of $1.55 trillion. Maybe we can squeeze a bit more out of these lemons but it won’t come close to closing the gap.
Higher income taxes on the rich won’t save the day. So what about taxing some of that fabulous wealth? That’s a topic for the next post.
In the meantime, here’s a bonus chart from Thomas Piketty, darling of the American left. It turns out that super-rich Americans pay higher taxes than their French counterparts:

The Interpretation reads: “In France in 2018, the total effective tax rate is about 45% for bottom income groups, 50-55% for middle and upper-middle income groups, and 45% for the highest income groups.” Source: See http://piketty.pse.ens.fr/files/ideology/pdf/F11.19.pdf
References:
“Estimating Tax Burdens by Wealth Groups” by Balkir et al/US Department of Treasury, Office of Tax Analysis, Aug. 2, 2024. https://www.irs.gov/pub/irs-soi/24rpestimatingtaxburdens.pdf
“The Super-Rich Pay Super-Amounts of Taxes, New Treasury Report Finds” by Scott Hodge/The Tax Foundation, November 7, 2024. https://taxfoundation.org/blog/super-rich-pay-effective-tax-rates/