Edward Wolff is an economics professor at New York University. He also works at the Levy Institute Measure of Economic Well-Being and the National Bureau of Economic Research (NBER). In keeping with his professional focus on wealth and wealth disparity, Wolff recently authored The Extraordinary Rise in the Wealth of Older American Households (NBER, 2025). Here’s the Abstract from that paper:
“There has been a seismic shift in age-wealth profiles in the U.S. over years 1983 to 2022. The most notable is the sharp rise in the relative household wealth of age group 75 and over. Correspondingly, the relative wealth holdings of all other age groups dropped over these years. Using the Survey of Consumer Finances, the paper focuses on the youngest age group, 35 and under, and the oldest age group, 75 and over, and analyzes the factors behind these relative shifts in wealth. I find that the three principal factors are the homeownership rate, total stocks directly and indirectly owned, and home mortgage debt. The homeownership rate is the same in the two years for the youngest group but falls relative to the overall rate, whereas it shoots up for the oldest group both in actual level and relative to the overall average. The value of stock holdings rises for both age groups but vastly more for the oldest households compared to the youngest ones and accounts for a substantial portion of the elderly’s relative wealth gains. Mortgage debt rises in dollar terms for both groups but considerably more in relative terms for the youngest group.”
In this series of posts, I’ll present charts that document Wolff’s main points: the age-wealth gap has been growing for decades and is huge; and differences in homeownership, stock holdings, and mortgage debt are the three main factors behind this age-related shift in relative wealth. The charts are my own creation, based on Wolff’s computations and tables.
First, the growing wealth gap between old and young-ish:
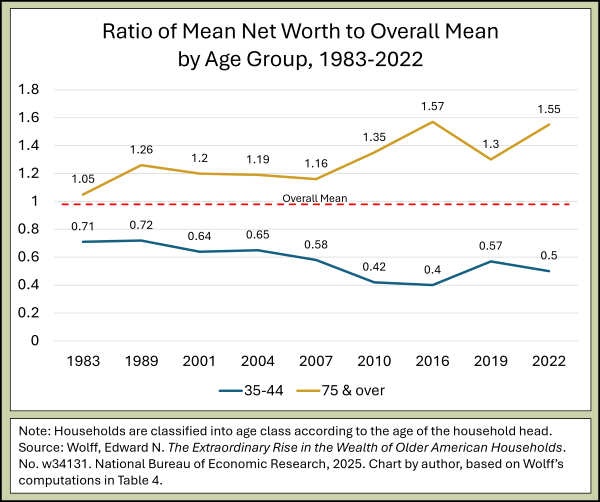
Note the chart didn’t include the net worth for under 35s, mainly because I thought the figures for the 35-44 age group were more interesting. It’s already well-known that over the past few decades increasing numbers of young Americans have stayed in school longer and married later than earlier generations, and that education and marriage typically precede serious wealth-building, eg, buying a home. What this chart shows is that early delays in wealth-building lead to slower wealth accumulation later on.
Next: Home ownership
Reference:
Wolff, Edward N. The Extraordinary Rise in the Wealth of Older American Households. No. w34131. National Bureau of Economic Research, 2025. DOI: 10.3386/w34131