Recap:
Pew Research has just come out with a new typology that sorts the American public into nine groups based on their political values and beliefs. This is their ninth political typology study since the first one in 1987. The current typology is based on a survey of 10,357 U.S. adults conducted in November 2025. The 2026 Pew report includes additional data on the same respondents from 15 separate surveys conducted over the course of 2025 and 2026, as well as records from prior Pew Research election surveys and commercial voter files. Throughout this series, I’ll be delving into the data, looking for patterns and seeking a deeper understanding of what the hell in going on in this country.
Here are the nine types:
No Apologies Right: Unwavering Trump supporters with a pugilistic political style and an ‘America first’ outlook - 9% of U.S. adults and 19% of the Republican Party.
Faith First Conservatives: Staunch conservatives and strong Trump supporters who stand out for their faith-oriented politics - 12% U.S. adults and 25% of the Republican Party.
Unconventional Right: Conservative on immigration and culture, but they break from those to their right on some other key issues - 12% of U.S. adults and 19% of the Republican Party.
Pragmatic and Polite Right: Moderate in tone and on many issues, with a small-government streak - 11% of U.S. adults and 14% of the Republican Party.
Order and Opportunity Left: Economically liberal positions with moderate stances on immigration and concerns about safety and crime - 18% U.S. adults and 24% of the Democratic Party.
Left-Out Left: Democratic-leaning, with a mix of liberal and moderate views and limited confidence in the parties and the political system - 12% U.S. adults and 18% of the Democratic Party.
Loyal Liberals: Liberal across most issues, they are invested in the Democratic Party and in domestic and international institutions - 11% of U.S. adults and 21% of the Democratic Party.
Leftward Progressive: Liberal across the board, they are among the strongest critics of the U.S. economic system and the Trump administration - 7% of U.S. adults and 14% of the Democratic Party.
Tuned-Out Middle: Largely disconnected from politics, they tilt liberal on economic concerns but not on social issues - 9% of U.S. adults, 8% of the Republican Party, and 9% of the Democratic Party.
Source: Beyond Red vs. Blue: The Political Typology / Pew Research Center, Washington, D.C. June 10, 2026. Supplementary material: Appendix A, Appendix B, and Appendix C.
The last post looked at how well individuals across the political spectrum are able to manage their household expenses, as reflected by their self-reported ability to pay bills in full in a typical month and to meet their basic expenses with some left over for extras. Loyal Liberals and Trump supporters performed best in this regard: over three-fourths of the Loyal Liberals, No Apologies Right and Faith First Conservatives were able to pay their bills in full and over two-thirds were able to meet their basic expenses with some left over. Not surprisingly, the Left-Out Left and Tuned-Out Middle brought up the rear in both cases.
But successful management of household expenses says little about household income. Plenty of poor people pay their bills on time; plenty of rich people don’t. What I want to know is how well these folks are doing financially, broken down by political type. Luckily, the Pew Report has that information, in the form of income tiers. Here’s how Pew determines the income tier of survey panelists, as described in Appendix B:
Family income data reported in this study is adjusted for household size and cost-of-living differences by geography. Panelists then are assigned to income tiers that are based on the median adjusted family income of all American Trends Panel (ATP) members.
First, panelists are assigned to the midpoint of the income range they selected in a family income question that was measured on either the most recent annual profile survey or, for newly recruited panelists, their recruitment survey.
Next, these income values are adjusted for the cost of living in the geographic area where the panelist lives. This is calculated using price indexes published by the U.S. Bureau of Economic Analysis…Family incomes are further adjusted for the number of people in a household.
Panelists are then assigned an income tier. “Middle-income” adults are in families with adjusted family incomes that are between two-thirds and double the median adjusted family income for the full ATP at the time of the most recent annual profile survey. The median adjusted family income for the panel is roughly $77,800. Using this median income, the middle-income range is about $51,900 to $155,600.
I’m particularly interested in how many people of each political type are doing okay financially, operationalized as middle-income or higher. This is what Pew found:
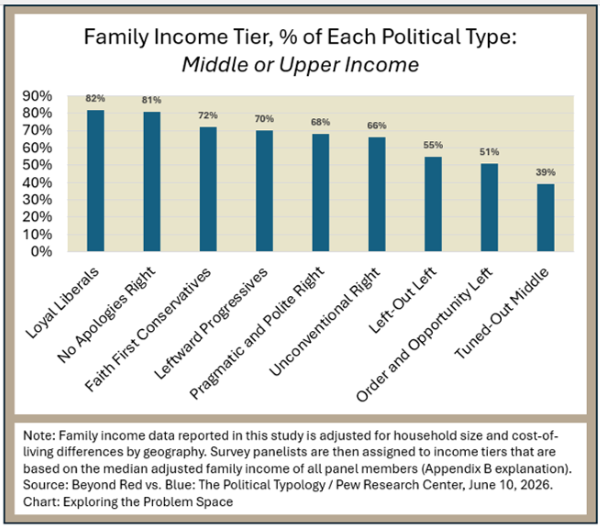
Once again, Loyal Liberals and the strongest Trump supporters lead the pack. Loyal Liberals make sense, since over 60% are college grads+. But only a third of No Apologies Right and Faith First Conservatives are college grads, yet they’re doing just fine. And the No Apologist Right - “unwavering Trump supporters” - are mostly working class:
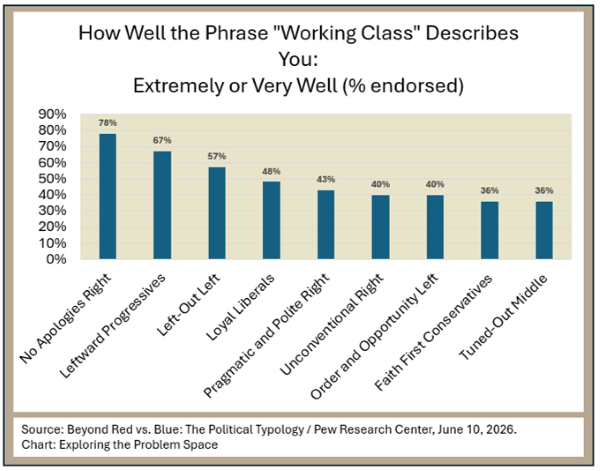
Note that most Faith First Conservatives do not consider themselves working class, yet two-thirds lack a college degree and still belong to the middle-or upper-income tier in their communities. So how do they earn their money?
The Progressive Left is another interesting case: around half are college graduates and 70% are in the middle or upper income tier, yet two-thirds consider themselves working class. I have a feeling that what people consider “working class” varies across the political types. Another possibility is that the Progressive Left are the youngest of the types (14% 18-29, compared to just 3% for the No Apologies Right) and many are still in the working class phase of their lives. Think waiters and baristas.