Recap:
Pew Research has just come out with a new typology that sorts the American public into nine groups based on their political values and beliefs. This is their ninth political typology study since the first one in 1987. The current typology is based on a survey of 10,357 U.S. adults conducted in November 2025. The 2026 Pew report includes additional data on the same respondents from 15 separate surveys conducted over the course of 2025 and 2026, as well as records from prior Pew Research election surveys and commercial voter files. Throughout this series, I’ll be delving into the data, looking for patterns and seeking a deeper understanding of what the hell in going on in this country.
Here are the nine types:
No Apologies Right: Unwavering Trump supporters with a pugilistic political style and an ‘America first’ outlook - 9% of U.S. adults and 19% of the Republican Party.
Faith First Conservatives: Staunch conservatives and strong Trump supporters who stand out for their faith-oriented politics - 12% U.S. adults and 25% of the Republican Party.
Unconventional Right: Conservative on immigration and culture, but they break from those to their right on some other key issues - 12% of U.S. adults and 19% of the Republican Party.
Pragmatic and Polite Right: Moderate in tone and on many issues, with a small-government streak - 11% of U.S. adults and 14% of the Republican Party.
Order and Opportunity Left: Economically liberal positions with moderate stances on immigration and concerns about safety and crime - 18% U.S. adults and 24% of the Democratic Party.
Left-Out Left: Democratic-leaning, with a mix of liberal and moderate views and limited confidence in the parties and the political system - 12% U.S. adults and 18% of the Democratic Party.
Loyal Liberals: Liberal across most issues, they are invested in the Democratic Party and in domestic and international institutions - 11% of U.S. adults and 21% of the Democratic Party.
Leftward Progressive: Liberal across the board, they are among the strongest critics of the U.S. economic system and the Trump administration - 7% of U.S. adults and 14% of the Democratic Party.
Tuned-Out Middle: Largely disconnected from politics, they tilt liberal on economic concerns but not on social issues - 9% of U.S. adults, 8% of the Republican Party, and 9% of the Democratic Party.
Note: Pew’s typologies reveal patterns and opinion clusters in complex data. They are not universal essences or timeless categories that discount individual variation or change. To be a political type is to have views and opinions that are closer to one data cluster than the others.
Source: Beyond Red vs. Blue: The Political Typology / Pew Research Center, Washington, D.C. June 10, 2026. Supplementary material: Appendix A, Appendix B, and Appendix C.
—
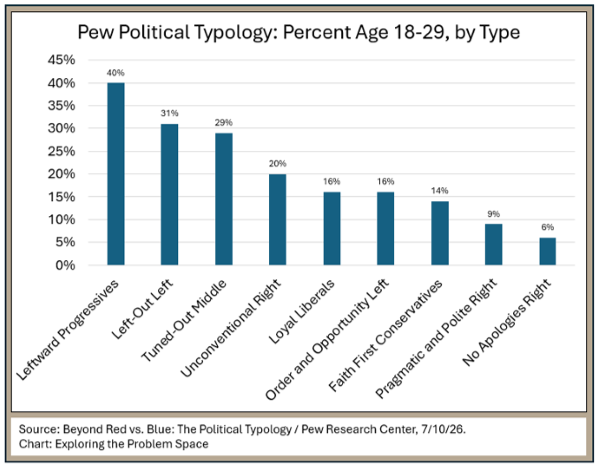
My last post focused on whether Americans across the spectrum consider billionaires bad for the country. Answer: apparently not. Just 30% of Pew panelists thought so. This post will look at the political types by age groups, specifically the percent of young adults (18-29), older adults (50+) and adults at the age of highest median income (35-44). First, young adults:
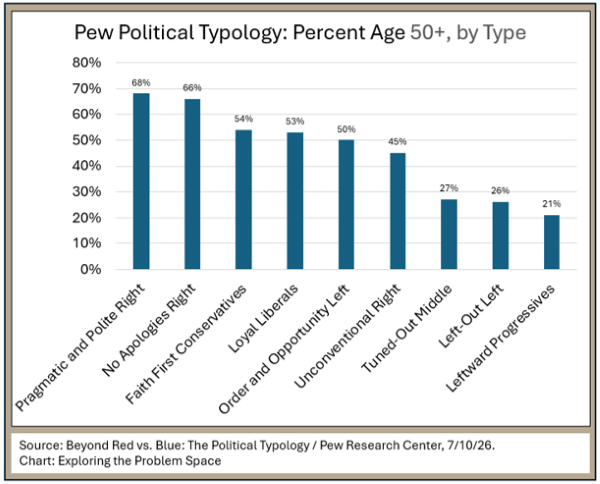
Now, older adults:
Now for adults at peak earning age:

Ok, so Leftward Progressive skew really young, and relatively few have ridden the wave of their peak earning years and come out on the other side (that would be the 50+ age group). I’m not surprised that many lack a certain appreciation of what the US economy and education system has to offer.
Social mobility over the lifespan is not dead, but try telling that to a 26 year old sociology major.