Recap:
Edward Wolff is an economics professor at New York University. In keeping with his professional focus on wealth and wealth disparity, Wolff recently authored The Extraordinary Rise in the Wealth of Older American Households (NBER, 2025). Here’s the Abstract from that paper:
“There has been a seismic shift in age-wealth profiles in the U.S. over years 1983 to 2022. The most notable is the sharp rise in the relative household wealth of age group 75 and over. Correspondingly, the relative wealth holdings of all other age groups dropped over these years. Using the Survey of Consumer Finances, the paper focuses on the youngest age group, 35 and under, and the oldest age group, 75 and over, and analyzes the factors behind these relative shifts in wealth. I find that the three principal factors are the homeownership rate, total stocks directly and indirectly owned, and home mortgage debt. The homeownership rate is the same in the two years for the youngest group but falls relative to the overall rate, whereas it shoots up for the oldest group both in actual level and relative to the overall average. The value of stock holdings rises for both age groups but vastly more for the oldest households compared to the youngest ones and accounts for a substantial portion of the elderly’s relative wealth gains. Mortgage debt rises in dollar terms for both groups but considerably more in relative terms for the youngest group.”
In this series of posts, I’ll present charts that document Wolff’s main points: the age-wealth gap has been growing for decades and is huge; and differences in homeownership, stock holdings, and mortgage debt are the three main factors behind the age-related shift in relative wealth. The charts are my own creation, based on Wolff’s computations and tables.
I have created several charts based on Wolff’s data and computations. The chart in the first post of this series documented the growing age-wealth gap over the period of 1983-2022. The chart in the second post revealed the diverging homeownership gap over the same period. The last post addressed role played by financial assets involving stock ownership in the growing age-wealth gap. Now for my last chart, regarding the ratio of housing debt to home value, by age group:
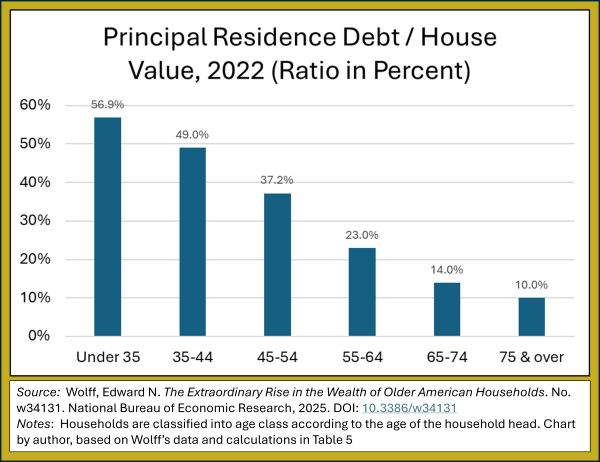
The median age of first-time homebuyers in the US has been rising for decades, from around 28 in the late 1980s to a record high of 40 in late 2025. This is a problem, because many Americans build wealth using home equity—the difference between a home's market value and its remaining mortgage balance—by leveraging it for debt consolidation or investments such as buying rental property, starting a business, or even going back to college to qualify for better jobs (Southern Trust, 2025; Rate, 2025; Unison, undated; CBS New, 2024; Chase Bank, 2025). The problem is more than one of delayed wealth accumulation; it’s also about the timing and the pace of accumulation. By the time homeowners have built up sufficient home equity to leverage it for bigger and better things, many will have reached their late 40s and early 50s, not an optimal age for high-risk, high-stress, high-effort endeavors like starting a business or changing careers, where the potential payoff is many years and tears away.
In other words, delayed homebuying and the drag of paying off mortgage debt slows the accumulation of wealth over the lifespan. So the age-wealth gap is likely to become even bigger.
—
Note: As for student debt, Wolff rejects it as a major factor in explaining the decline in the [under-35] group’s net worth ratio. Explanation on p. 23.
Reference: Wolff, Edward N. The Extraordinary Rise in the Wealth of Older American Households. No. w34131. National Bureau of Economic Research, 2025. DOI: 10.3386/w34131